Peak ground acceleration, peak ground velocity and JMA seismic intensity are shown below.
| Name of seismic station | PGA | PGV | JMA seismic intensity |
|---|---|---|---|
| 2016 Kumamoto Earthquake (KiK-net Mashiki) | 1313.8 | 131.8 | 6.49 |
| 2016 Kumamoto Earthquake (Mashiki-machi Miyazono seismic intensity meter) | 897.4 | 183.6 | 6.77 |
| 1995 Hyogo-Ken Nanbu Earthquake(JR Takatori) | 742.7 | 161.9 | 6.49 |
| 2011 Tohoku Earthquake(K-NET Tsukidate) | 2765.2 | 105.8 | 6.67 |
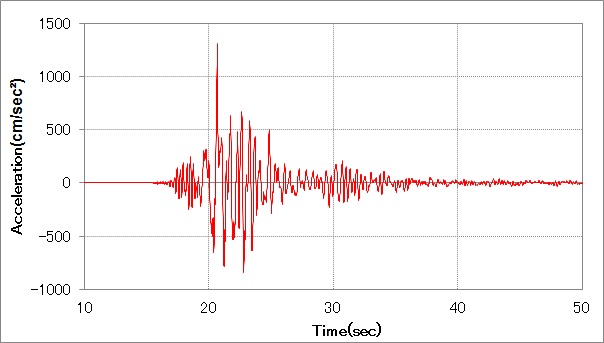
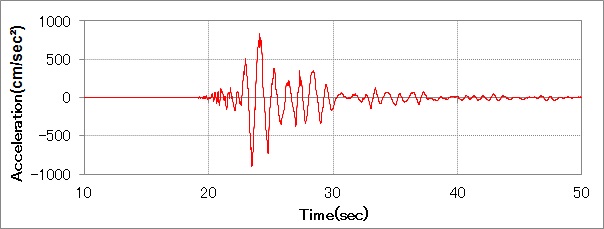
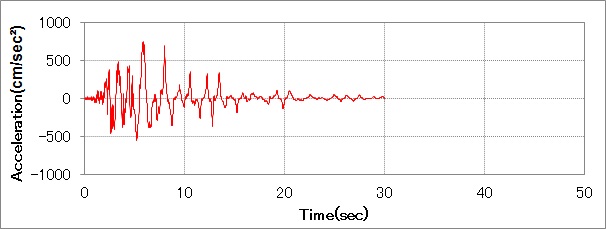
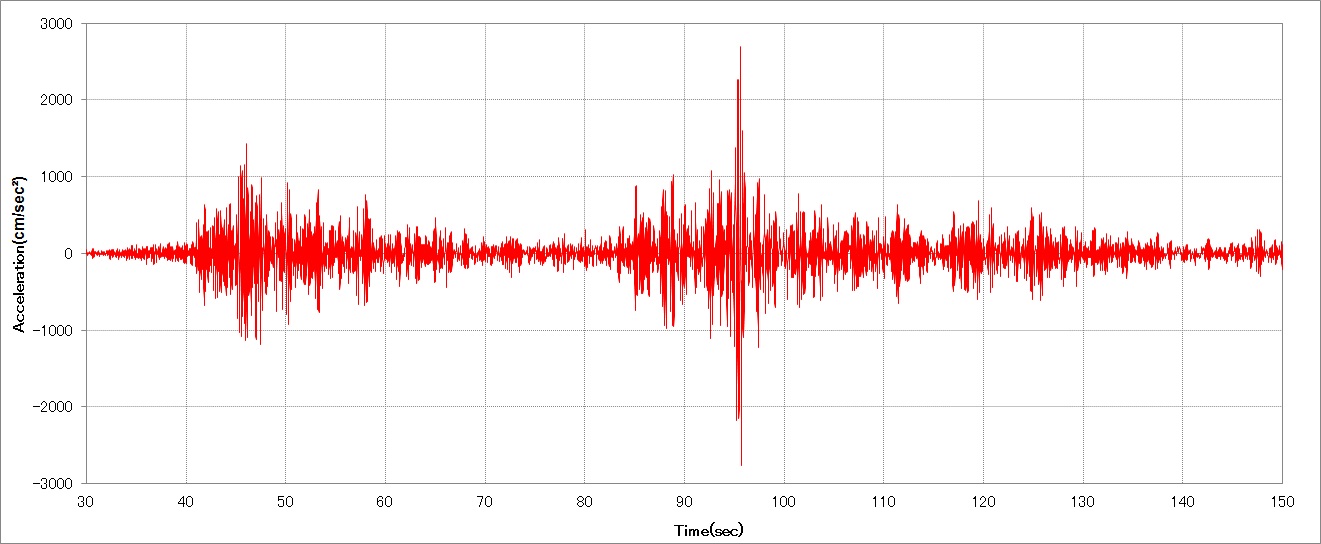
Acceleration waveforms (maximum direction of vector sum of two horizontal directions) are shown below.
Kumamoto Earthquake (KiK-net Mashiki)
Kumamoto Earthquake (Mashiki-machi Miyazono seismic intensity meter)
Hyogo-Ken Nanbu Earthquake(JR Takatori)
Tohoku Earthquake(K-NET Tsukidate)
Elastic acceleration response spectra (damping factor:5%,vector sum of two horizontal directions) are shown below.
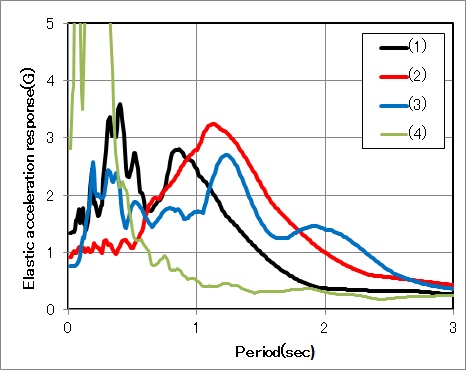
(1)Kumamoto Earthquake (KiK-net Mashiki), (2)Kumamoto Earthquake (Mashiki-machi Miyazono seismic intensity meter), (3)Hyogo-Ken Nanbu Earthquake(JR Takatori), (4)Tohoku Earthquake(K-NET Tsukidate)
The following shows seismic intensity that are calculated by proposal method. We can see the seismic ground motion intensity in the three period regions those are 0.1-1 sec. which corresponds to JMA seismic intensity, human body sense and indoor objects motions, 0.5-1 sec. which corresponds to moderate damage to buildings and 1-2 sec. which corresponds to heavy damage to buildings in the style of JMA seismic intensity.
| Name of seismic station | JMA seismic intensity | 0.1-1 sec seismic intensity | 0.5-1 sec seismic intensity | 1-2 sec seismic intensity | Proposal seismic intensity |
|---|---|---|---|---|---|
| 2016 Kumamoto Earthquake (KiK-net Mashiki) | 6.49 | 6.56 | 6.25 | 6.27 | 6.27 |
| 2016 Kumamoto Earthquake (Mashiki-machi Miyazono seismic intensity meter) | 6.77 | 6.16 | 6.01 | 6.87 | 6.87 |
| 1995 Hyogo-Ken Nanbu Earthquake(JR Takatori) | 6.49 | 6.10 | 5.77 | 6.63 | 6.63 |
| 2011 Tohoku Earthquake(K-NET Tsukidate) | 6.67 | 6.40 | 5.59 | 5.58 | 5.59 |
1-2sec. responses which bring about heavy damage to wooden houses and low to mid-rise buildings are much larger than those of the JR Takatori record in the 1995 Hyogoken-nanbu earthquake which were maximum in the past.
Location of the obsevation stations are here (益城町宮園震度計 and KiK-net益城)
Actural damage situations are here and here.
JMA recored site (Please read things to be aware of when using)
References:Sakai, Y., Koketsu, K. and Kanno, T., Method of calculating seismic intensities considering structural damage and human body sense., Proceedings of the 11th Japan Earthquake Engineering Symposium, 2002. Acknowledgment
Strong motion records were provided by NIED, Kumamoto Prefecture, JMA and Railway Technical Research Institute.
top page